NEW: Find your perfect tool with our matching quiz
Coding errors can cause unexpected problems. Code debugging is the process of finding and fixing these errors. We’ll break down what is debugging in coding and why it’s essential for coders.


Our team uses a bunch of tools that cost 0$ a month
Explore the best of them with our free E-book and use tutorials to master these tools in a few minutes
What is debugging? In simple terms
Debugging is the process of finding and fixing errors (or “bugs”) in computer programs. Reviewing each code line is crucial for ensuring clarity and correct logic in programming. When a program doesn’t behave as expected, developers use debugging techniques to identify the underlying issue and correct it.
Why is debugging important?

Debugging is crucial for several reasons:
Ensuring Correct Functionality: Debugging helps identify and fix errors that can cause programs to malfunction or produce incorrect results. This is essential for delivering reliable and accurate software.
Improving User Experience: Bugs can lead to frustrating user experiences, such as crashes, freezes, or unexpected behavior. By debugging, developers can create software that is more user-friendly and enjoyable.
Preventing Security Vulnerabilities: Some bugs can create security vulnerabilities that can be exploited by malicious actors. Debugging helps identify and address these issues, protecting both the software and its users from potential threats.
Increasing Efficiency: Debugging can help optimize code performance by identifying and removing unnecessary or inefficient operations. This can result in faster and more responsive software.
Maintaining Code Quality: Debugging is an integral part of maintaining high-quality code. By regularly identifying and fixing issues, developers can ensure that their codebase remains clean, well-structured, and easy to understand.
Types of debugging

There are quite a lot of debugging types but usually they can be categorized ,into 3 categories:
1. Build and Compile-Time Errors
Definition: These errors occur during the process of building or compiling the code. They are typically syntax errors or violations of programming language rules.
Detection: Usually caught by the compiler or build system during the compilation process.
2. Runtime Errors
Definition: These errors occur while the program is running, often due to unexpected conditions or invalid input. Developers use debugging tools to run their programs step-by-step, a practice known as ‘code step’, to identify and resolve errors.
Detection: May not be caught by the compiler, and can lead to unexpected behavior or crashes.
3. Logic Errors
Definition: These are errors in the program’s logic or algorithm that result in incorrect output or behavior.
Detection: Often difficult to find, as they don’t typically cause the program to crash. They may only become apparent when the program produces incorrect results.
What are debugging tools and software?
Debugging tools and software are essential companions for developers to help them identify, isolate, and fix errors or bugs in their code. These tools provide a variety of features to make the debugging process more efficient and effective. Here are some good tools you can use:
#1 Visual Studio Code
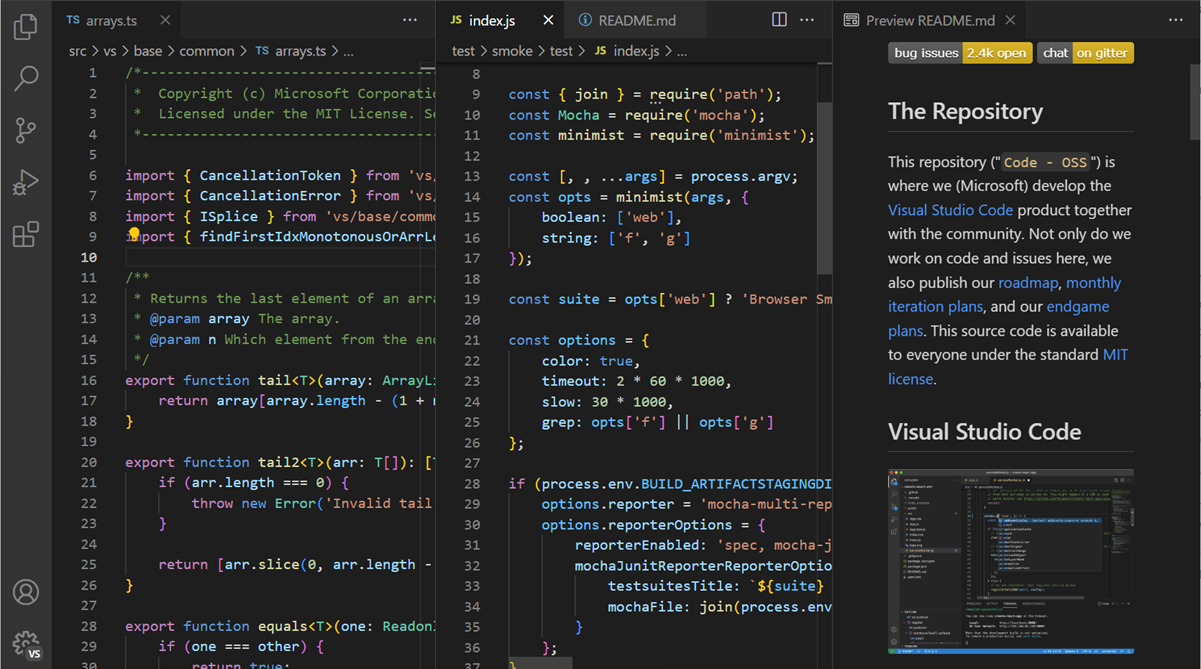
Visual Studio Code (VS Code) is a versatile code editor designed to boost productivity. It’s lightweight yet powerful, offering support for numerous programming languages. With GitHub Copilot integration, it provides AI-driven code suggestions, making coding faster and more efficient.
Key Features:
- AI-Powered Coding with GitHub Copilot: VS Code pairs with GitHub Copilot to provide smart code completions. It suggests lines of code based on your context, speeding up the coding process.
- Extensive Language Support: VS Code offers built-in support for languages like JavaScript, Python, C++, HTML, and more. Extensions are available to add even more language options.
- Customizable Experience: Adjust the editor to your style with color themes, layout options, and profiles. Settings Sync lets you share your setup across devices.
- Integrated Terminal and Debugging: VS Code includes a built-in terminal, allowing you to run commands directly. Debugging tools help catch errors without leaving the editor.
- Version Control: It provides built-in Git support, making version control seamless. You can also connect to other source control providers through extensions.
- Remote Development: Work on projects from any location using VS Code’s remote development feature. It’s compatible with cloud environments, including GitHub Codespaces.
#2 XCode
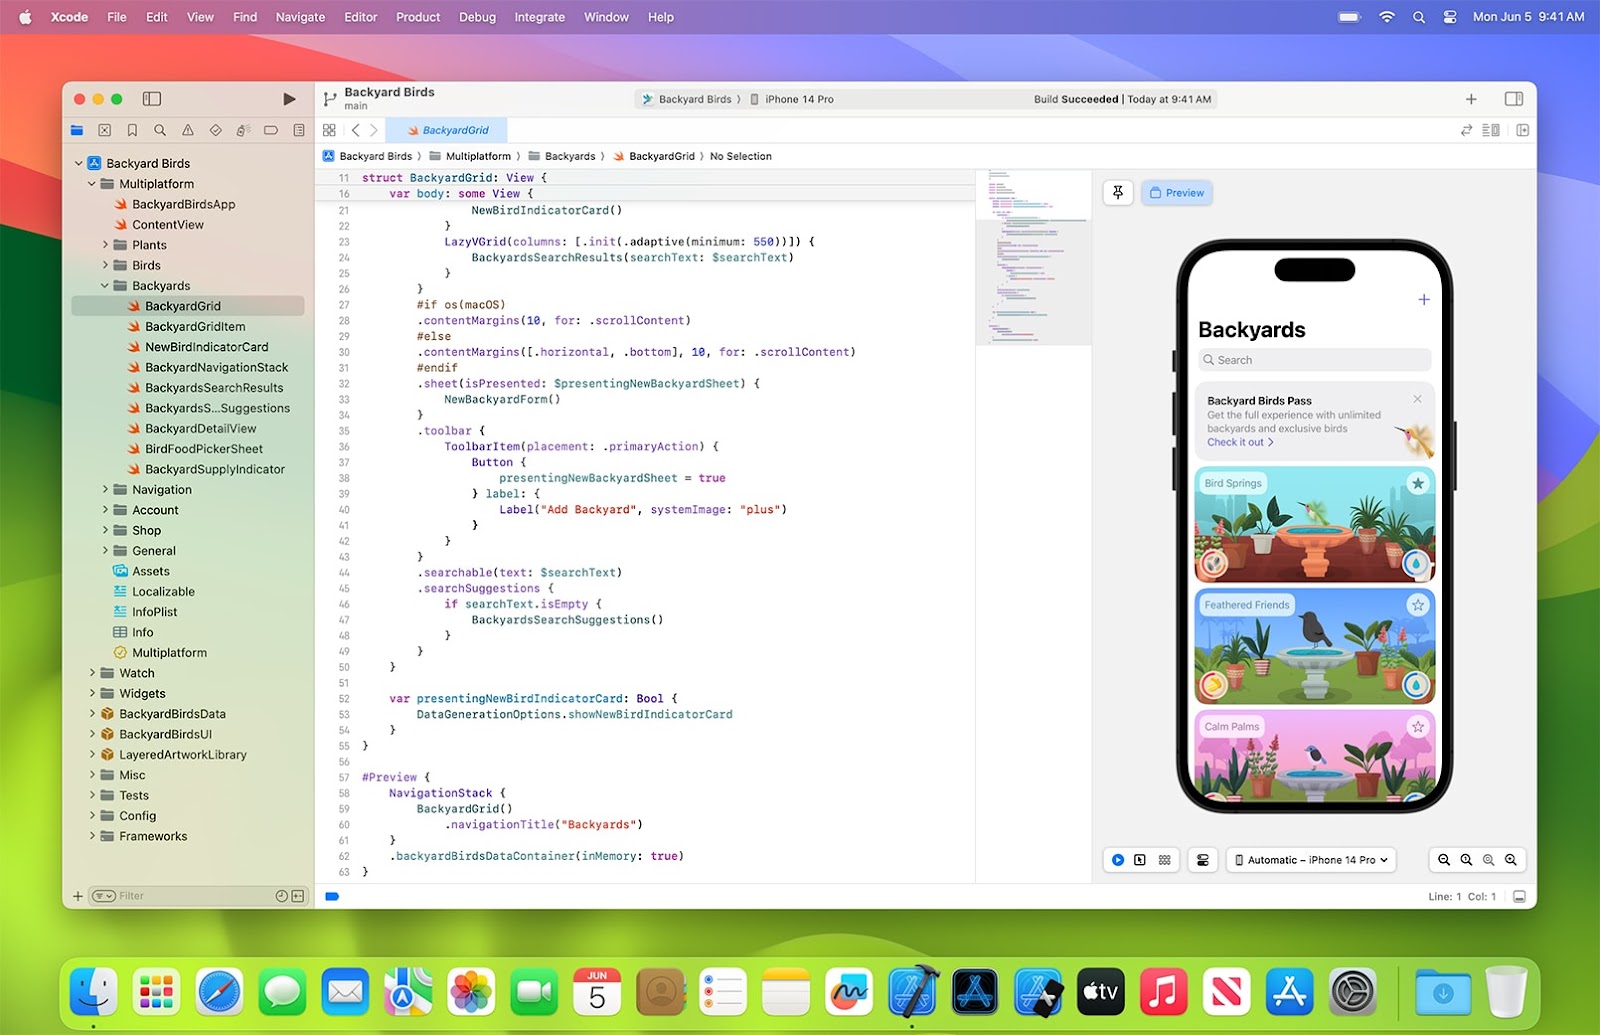
Xcode is Apple’s integrated development environment (IDE) for building apps across all Apple platforms. It offers a unified workspace for coding, testing, and distributing applications with features designed for Swift and SwiftUI development.
Key Features:
- Predictive Code Completion: Xcode’s predictive code completion speeds up coding by suggesting Swift code snippets. It’s trained on Apple’s SDKs for improved accuracy.
- Interactive Previews: Swift and SwiftUI developers benefit from interactive previews. This allows you to view live updates as you design, ensuring your app looks great across devices.
- Advanced Debugging: Xcode offers advanced debugging with breakpoints, macros, and a structured console. It makes error detection and correction more efficient.
- Integrated Xcode Cloud: Xcode Cloud provides continuous integration and delivery, automating builds, tests, and deployment. It’s designed to make your app development process smoother.
- Localization and Documentation: The String Catalog helps manage localization assets, while real-time previews enhance documentation quality. You can maintain an organized project structure effortlessly.
- Bookmark Navigator: Stay organized with the Bookmark Navigator, which lets you manage code landmarks and tasks. It’s a helpful tool for keeping your code structured.
#3 Cypress
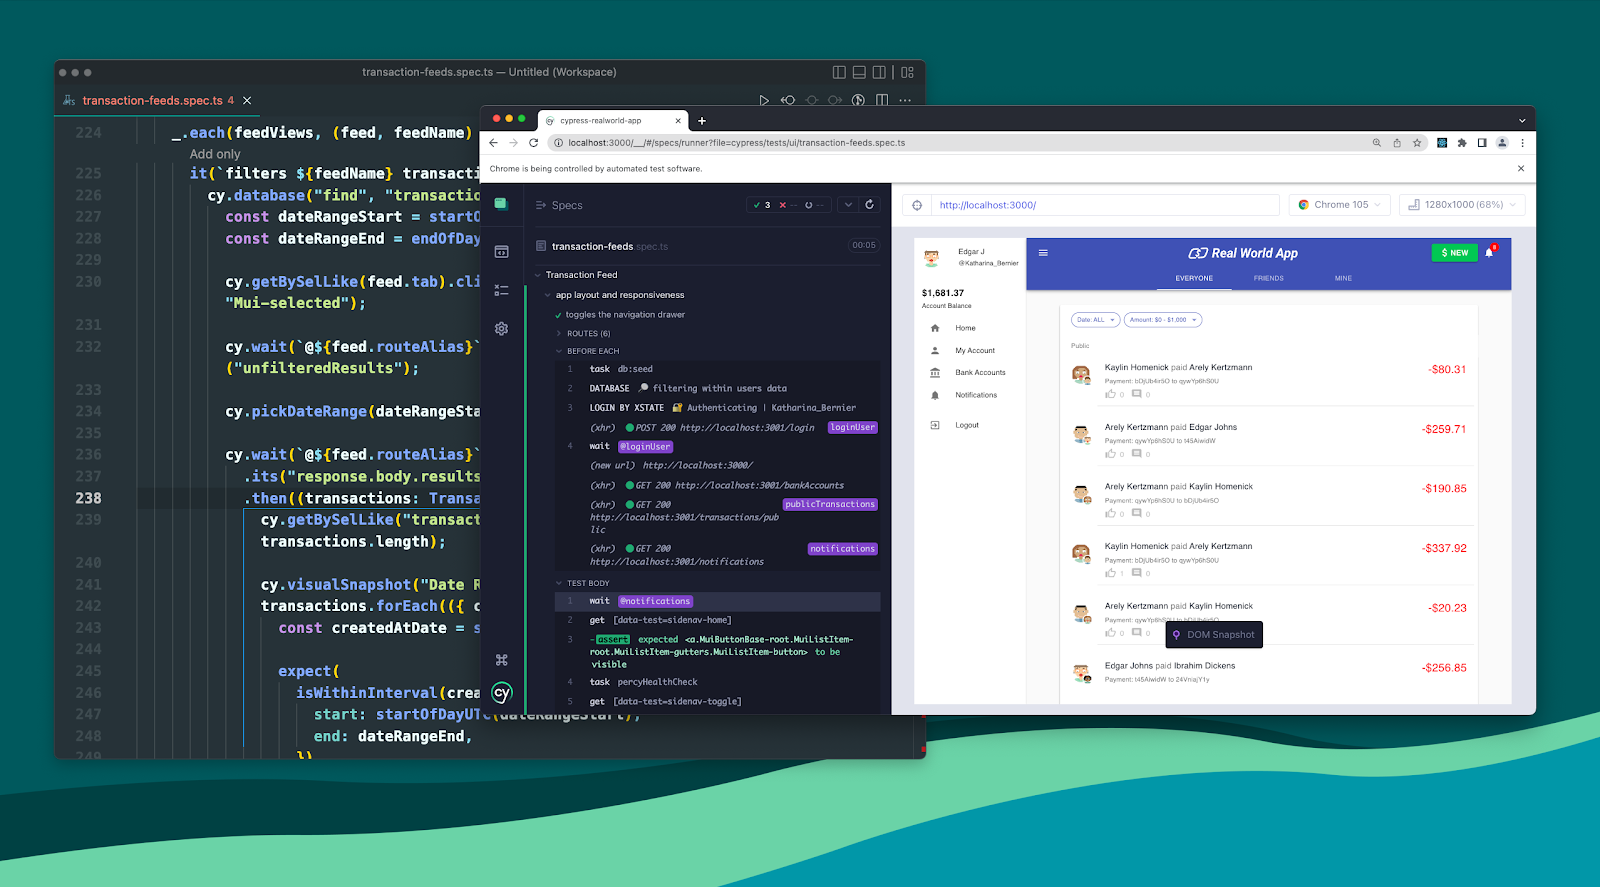
Cypress is a modern testing tool designed for creating, debugging, and automating tests for web applications. It runs directly in the browser, providing real-time feedback and an efficient testing experience.
Key Features:
- Real-Time Test Execution: Cypress lets you watch end-to-end and component tests run live. It offers immediate feedback as you develop, helping catch issues early.
- Browser Debugging: Debugging failures is straightforward since Cypress runs directly in the browser. Use familiar developer tools to inspect and fix problems instantly.
- Flaky Test Elimination: Cypress interacts deterministically with your app, mimicking real user behavior. It helps discover and fix intermittent bugs before they reach users.
- CI Integration: Easily integrate Cypress with any CI provider like GitHub Actions, CircleCI, or Jenkins. Its seamless integration allows you to monitor test results as part of your pipeline.
- Cypress Cloud: Enhance productivity with Cypress Cloud by using features like test parallelization and load balancing. It provides insights into your test suite’s health with in-depth analytics.
- UI Coverage and Accessibility Checks: Identify testing gaps with UI coverage visualization. Automated accessibility checks ensure your app is accessible, without requiring extra configuration.
#4 Flusk
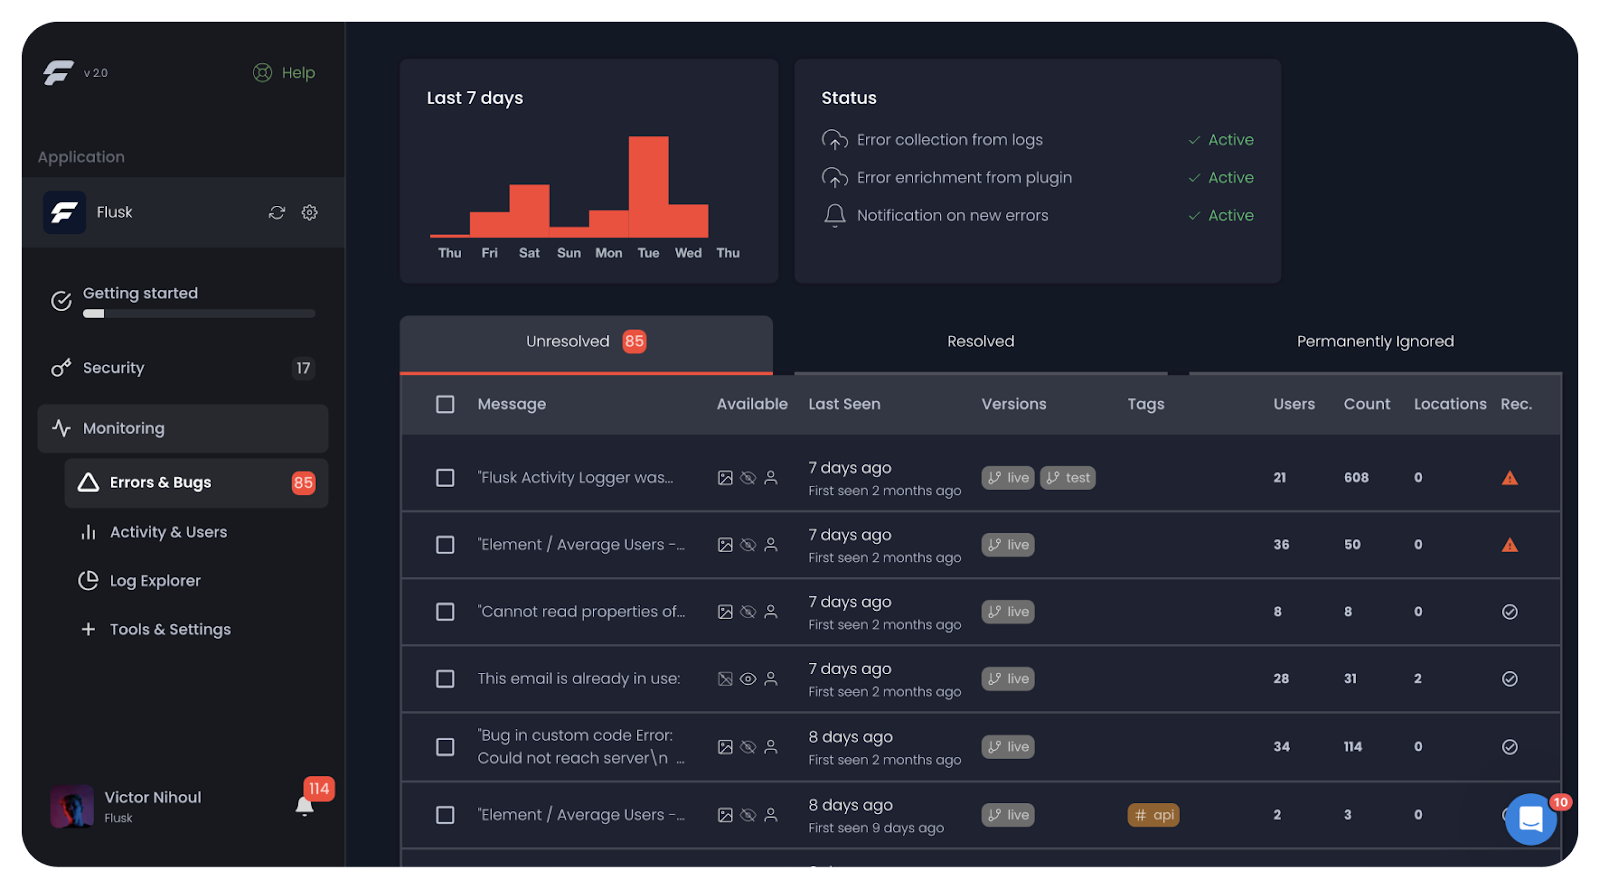
Flusk is a security and monitoring tool for Bubble.io applications. It’s designed to keep your app secure, monitor errors, and provide actionable insights, making it an essential tool for Bubble developers.
Key Features:
- Automated Security Checks: Flusk runs over 20 security checkpoints automatically each time you deploy. It sends detailed reports via email, ensuring you stay informed about your app’s security status.
- Comprehensive Monitoring: Flusk catches errors and bugs that users encounter, allowing you to fix issues quickly. The tool provides a centralized dashboard for error tracking and debugging.
- Smart Deployment: Deploy new app versions when no users are online, minimizing disruptions. This ensures smoother updates and a better user experience.
- Visual Log Exploration: Flusk offers an easy way to explore and inspect your Bubble logs. It simplifies the debugging process, making error resolution more efficient.
- Detailed Documentation: Each security issue is accompanied by expert-written documentation. This helps you understand and resolve vulnerabilities effectively.
#5 Chrome DevTools
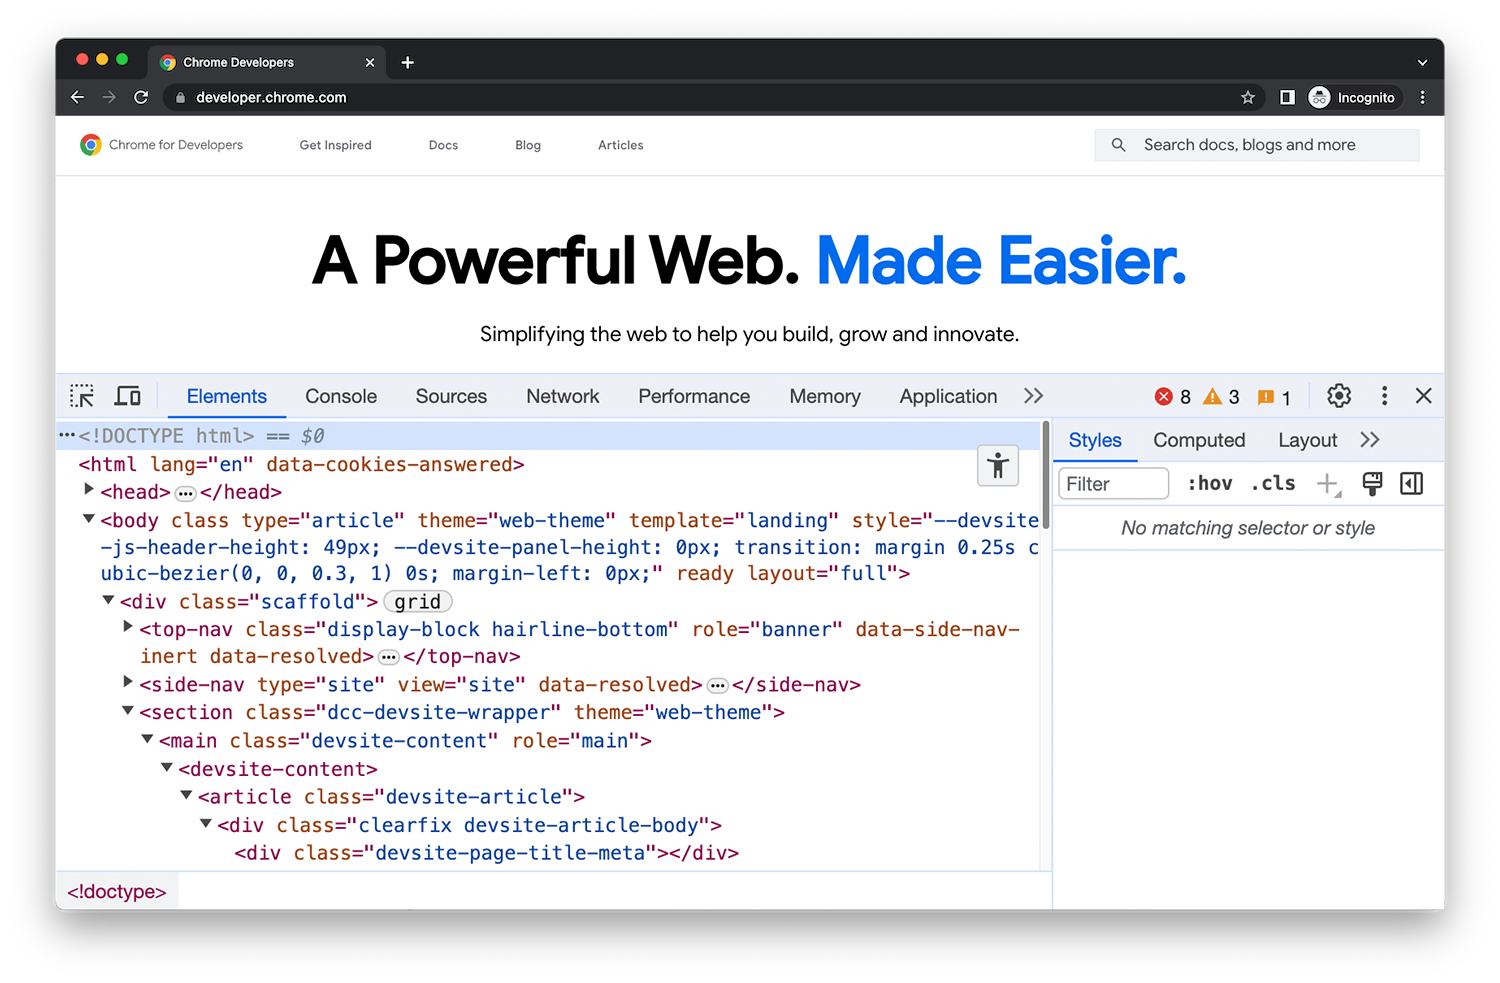
Chrome DevTools is a set of web developer tools built directly into Google Chrome. It allows you to edit web pages on the fly and quickly diagnose problems, making web development faster and more efficient.
Key Features:
- Real-Time Editing: DevTools lets you edit HTML, CSS, and JavaScript directly in the browser. This makes debugging and testing changes easy and efficient.
- Device Simulation: The device mode feature simulates mobile devices, helping you build and test mobile-first websites. It ensures that your designs are responsive across different screen sizes.
- Network Analysis: Monitor network requests and performance with the Network panel. It helps identify slow-loading resources, and optimizing website speed.
- Performance Insights: Use the Performance panel to evaluate your website’s load and runtime performance. This feature helps identify bottlenecks and optimize your site’s speed.
- Memory and Application Debugging: The Memory panel detects memory leaks, while the Application panel lets you inspect web app storage, cache, and more. These features are crucial for maintaining app efficiency.
- JavaScript Debugging: DevTools provides a powerful JavaScript debugger with breakpoints, snippets, and real-time console logging. It simplifies identifying and resolving coding issues.
How does the debugging process work to identify bugs?

The debugging process involves systematically identifying, analyzing, and fixing issues in software. Here’s a breakdown of how it typically works:
Identify the Problem:
- Error Messages: The Debugging process begins by looking at error messages, logs, or crash reports to pinpoint where the issue might be.
- Unexpected Behavior: Check areas where the program behaves differently from expected outcomes.
Reproduce the Issue:
- Consistently recreate the problem to understand its nature and the conditions that trigger it. This helps narrow down potential causes.
Isolate the Cause:
- Break down the code: Break down the code into smaller sections to isolate where the bug is located.
- Use Debugging Tools: Utilize breakpoints, step execution, and watches to examine variables and program flow at different stages.
- Review Code: Manually inspect the code logic, especially in areas where the issue manifests.
Formulate a Hypothesis:
- Based on observations, make an educated guess about what’s causing the problem. It could be incorrect logic, data handling, or configuration.
Test the Hypothesis:
- Modify the code or environment based on your hypothesis and test to see if it resolves the issue.
Fix the Issue:
- Apply the necessary code changes or configuration adjustments to correct the problem.
Validate the Solution:
- Re-test to ensure the bug is fixed and hasn’t introduced new issues. Also, test edge cases to ensure robustness.
Debugging vs. testing

Debugging and testing are both essential processes in software development, but they serve distinct purposes and involve different methodologies. Here’s a breakdown of their key differences:
Debugging
- Purpose: Identifying and fixing specific errors or bugs within a software application.
- Tools: Debuggers, loggers, and code profilers.
Testing
- Purpose: Assessing the overall quality and functionality of a software application before release.
- Tools: Test automation frameworks, test management tools, and defect tracking systems.
Final thoughts

Debugging is an essential skill for any developer. It ensures that software works as expected and provides a smoother user experience. Without effective debugging, applications can become unreliable, frustrating, or even insecure. Understanding the process is essential to building reliable software.
Choosing the right debugging tools can make all the difference. Tools such as Visual Studio Code, Xcode, Cypress, and Chrome DevTools offer valuable features for finding and fixing bugs. These tools help streamline the debugging process, making it more efficient for developers.
In the end, debugging improves software quality and user confidence. It’s not just about fixing problems; it’s about maintaining a codebase that works well. By debugging regularly, developers can ensure that their software remains reliable, secure, and easy to use.